
2014
September 25th, 26th, 27th
Sakshi Gupta '22
Kaito Iwasaki '23
Faculty Mentor: Robert O. Harmon, Ph.D., Professor of Physics and Astronomy
Starspots, like sunspots on the Sun, are 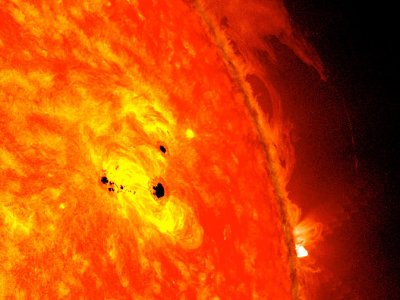 regions on a star's surface where the temperature is lower than the rest of the surface due to magnetic activity, causing them to be dark in comparison to the rest of the surface. As the dark starspots of a star are carried into and out of view from Earth by the star’s rotation, the star's brightness varies. Studying them provides a better understanding behind the physics of the magnetic fields of the Sun and other stars. After gathering the required data, surface plots were generated to visualize the structure of the star's surface. We took digital images of LO Pegasi, a star located 79 light-years from Earth, using a telescope at Perkins Observatory.
LO Pegasi is a spectral class K8 V star located 79 light-years from Earth. Its short rotation period of 10.153 hours gives it a strong magnetic dynamo, producing large starspots on the surface. Digital CCD camera images of LO Pegasi were acquired through B, V, R, and I photometric filters at Perkins Observatory using a 0.35-m aperture telescope. After performing standard bias and dark subtraction and flat fielding, differential aperture photometry was performed to generate plots of the star’s brightness as a function of time. We used a program called Light-curve Inversion that uses the brightness variation caused by the spots to map the surface of the star and visualize the appearance of surface structures. We compare a series of model surfaces from the years 2014 to 2020 to study the changes in spot configuration.
The following phenomenons take place in stars, resulting in the formation of starspots.
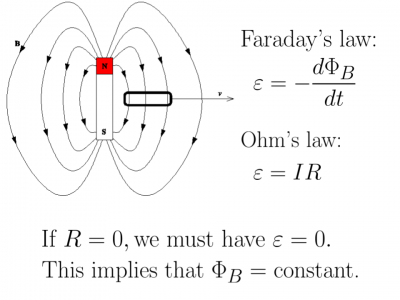
- Flux Freezing: Flux freezing is a phenomenon where magnetic field lines are conveyed with plasma. Due to the nearly zero resistivity of plasma, according to ohm’s law, R⟶0, then ε⟶0. Therefore, Faraday’s law implies that magnetic flux stays constant when ε=0. This suggests that magnetic field lines are frozen into the plasma and are carried with it.
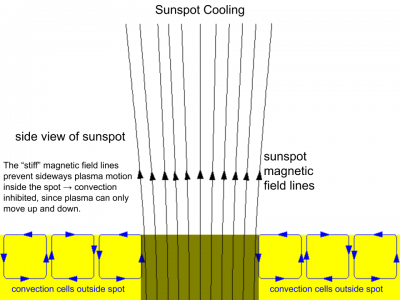
- Magnetic Tension: Magnetic fields are transported with plasma due to the flux freezing in a star. Above spots, the lines are directed vertically upward, and their magnitude is in the several kG ranges. When plasma moves with magnetic field lines, the v⨯B force produces strong magnetic tension to prevent lines from being curved. Thus the plasma can barely move horizontally, and convection below the spots is hindered. Consequently, energy transport under the spots has to rely on radiative diffusion, while convection is primarily a more efficient way to transport energy at the outer portion of the star than diffusion. Therefore, spots become cooler and darker than its surroundings. Starspots are carried into and out of our view from Earth as stars rotate. When a starspot is in our view, the overall brightness of the star gets smaller than when it is out of the view. And this is the way we observed the starspots.
 The LX600 telescope and the QSI 632 CCD Camera were used to study LO Pegasi. We took separate exposures through different colored filters, namely Blue, Visual, Red, Infrared filters (BVRI).
As the star rotates, it's dark spots are carried in and out of view from the Earth. A program called ‘Light Inversion’ uses these brightness variations to map the surface of LO Pegasi.
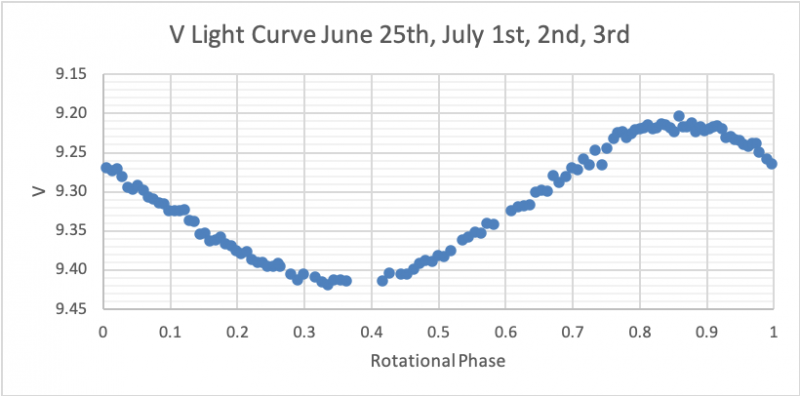
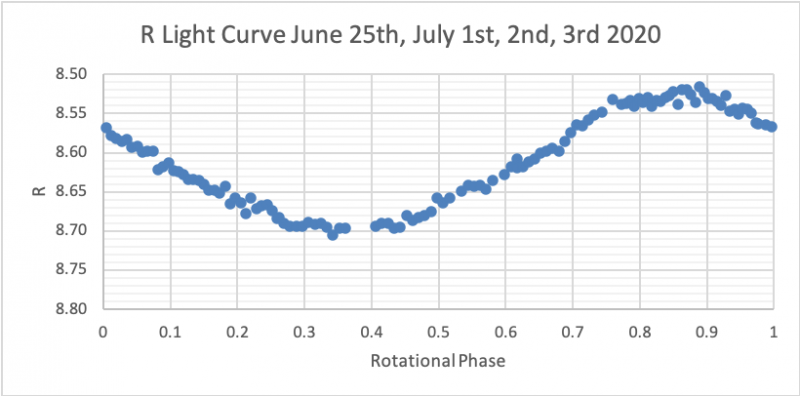
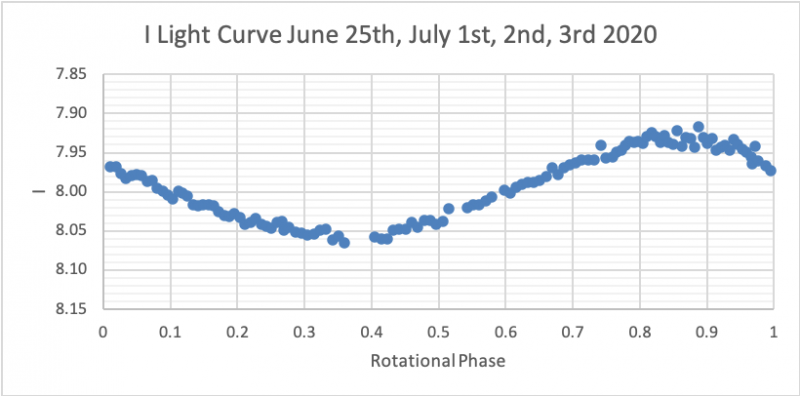
We took Images of LO Pegasi through the BVRI Filters with different exposure times on June 25th, July 1st, 2nd, and 3rd.
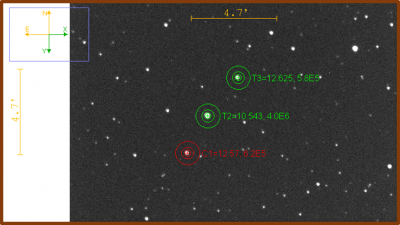 Image Calibration Using AstroImageJ:
- We inserted a World Coordinate System (WCS) using ‘TheSkyX’ program to track the star precisely using their celestial coordinates - their right ascensions and declinations.
- In order to apply dark filed frames to light or flat field frames that do not have the same exposure as the darks, we created a Master Bias Frame.
- We essentially take a picture of the ‘dark’ taken at the same temperature and exposure time as the light images and subtract this Master Dark Frame from the light frame to remove the pattern noise from the resulting image.
- To remove the effects of vignetting that may occur and the fixed pattern variations present in all CCDs, we subtracted the Master Flat Field from the dark subtracted frames.
- Finally, we applied the Master Frames we created to the light frames to create the fully calibrated frames on which we performed aperture photometry.
Aperture Photometry Using AstroImageJ:
- Aperture Photometry essentially consists of summing all the ‘pixels’ within a defined aperture which is centered on an object (here, star) and subtracting the product of the surrounding mean sky count per pixel and the number of pixels within the aperture.
- We marked the target and comparison stars and then exported the coordinates of the apertures into a text file
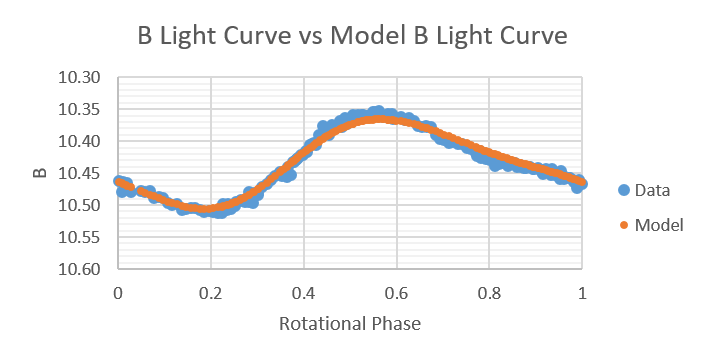
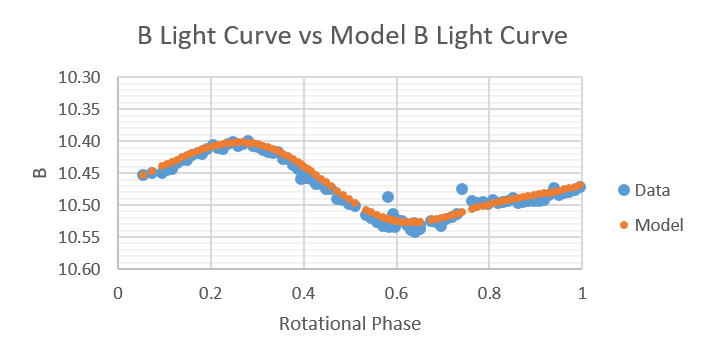
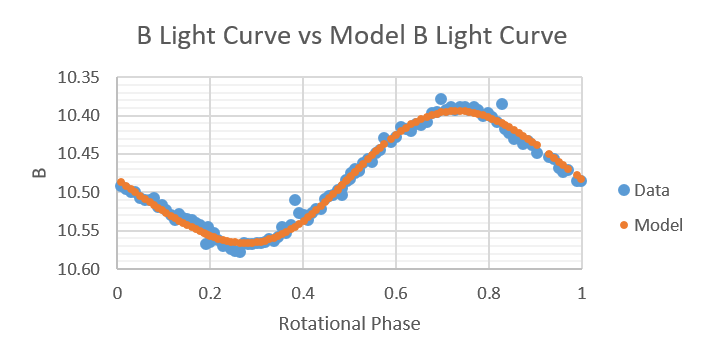
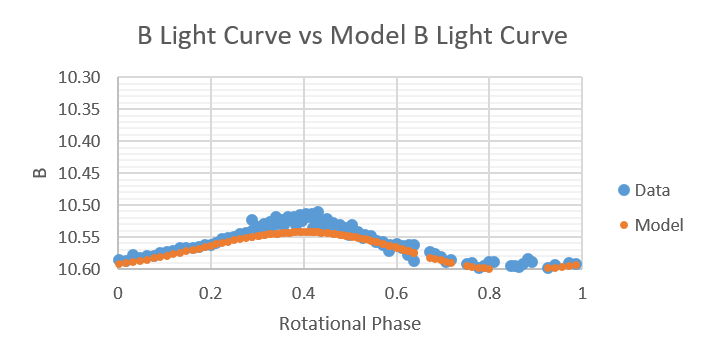
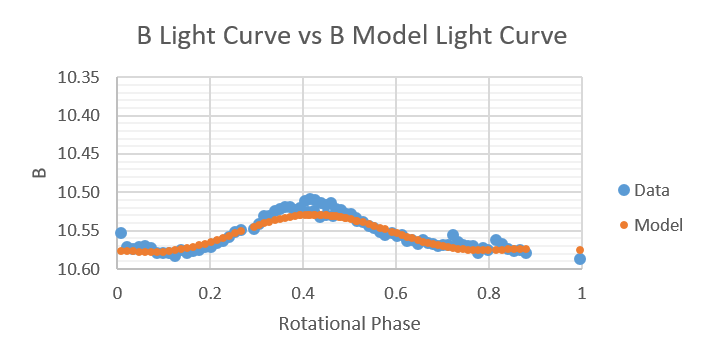
Plotting the Light Curves: We plotted these stellar magnitudes that we obtained from photometry, as a function of the rotational phase for each of the four BVRI filters.
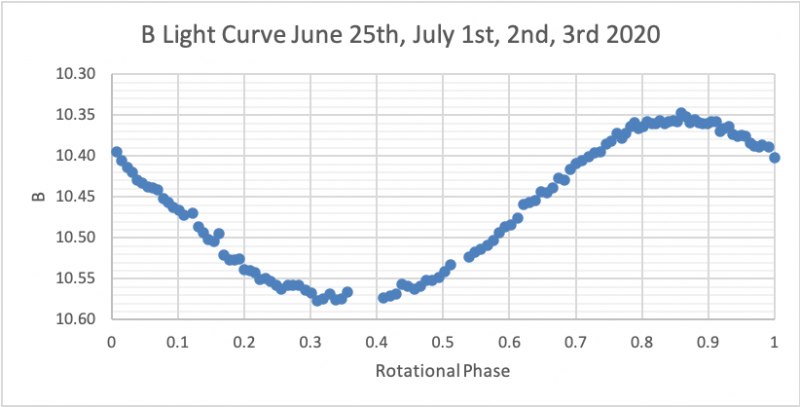
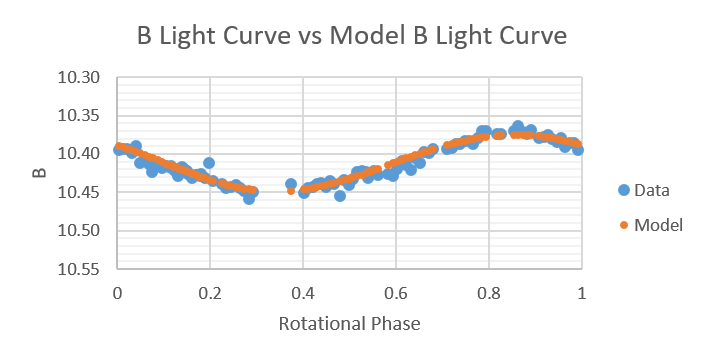
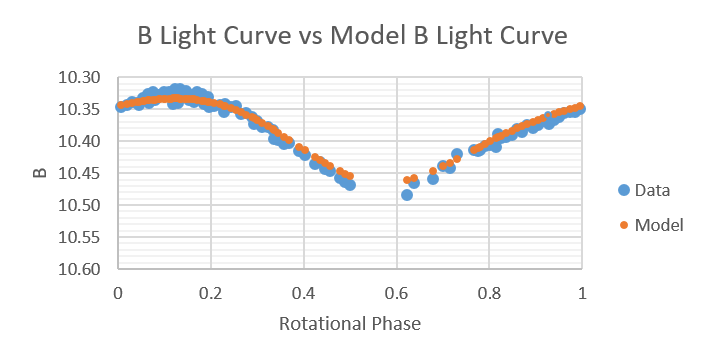
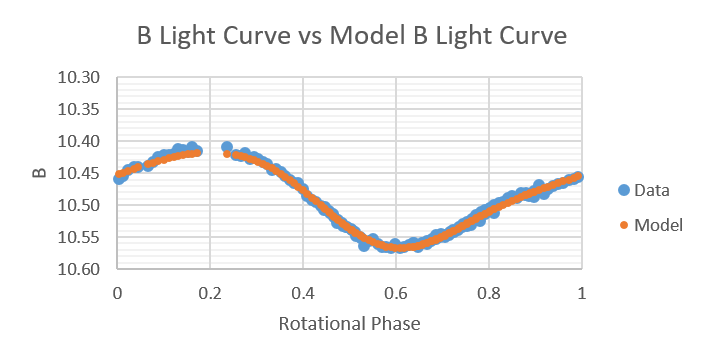
Shown below are plots of B light-curves compared to B light-curves produced by the model from 2014 to 2019.
2014 September 25, 26, 27
2015 July 31, August 1
2016 May 22, June 9, 25, 26
2017 June 1, 2, 3, 11
2017 July 9, 19, 20
2018 July 7, 8, 9
2019 June 26, July 2, 9
2019 July 12, 13
Light-curve Inversion (LI) is an algorithm developed by Harmon that indirectly deduces surface structures of stars using data of their light curves. LI has its advantage that no assumptions regarding spots and their shapes or locations are made in advance. The stellar surface is partitioned into a set of patches in determining its surface structure. LI assigns specific intensities to each patch such that the deduced surface looks as close to appropriate surface intensity as possible.
September 25th, 26th, 27th

July 31st, August 1st

May 22nd, June 9th, 25th, 26th

June 1st, 2nd, 3rd, 11th

July 9th, 19th, 20th

July 7th, 8th, 9th

June 26th, July 2nd, 9th

July 12th, 13th

June 25th, July 1st, 2nd, 3rd