It's Inauguration Day!
Congratulations, Matt vandenBerg, OWU's 17th President!
View details for Inauguration Day and stream the event live.
Congratulations, Matt vandenBerg, OWU's 17th President!
View details for Inauguration Day and stream the event live.
Steroid receptor coactivators (SRCs) are primary platform coactivators that are responsible for the transcriptional activity of nuclear receptors and transcription factors. SRCs are expressed in several different kinds of cells, including immune cells. The SRCs bind directly to nuclear receptors, which is bound to the DNA, and allow co-coactivators such as p300, CBP, and CARM1 to bind with the SRC/nuclear receptor complex.
SRC-3 is encoded by the NCOA3 gene, also known as Amplified in Breast Cancer 1 (AIBC1). In breast and other cancers, SRC-3 is frequently overexpressed or amplified. Annually, there are at least 733,000 new SRC-3 related cancer cases and 319,000 SRC-3 cancer related deaths in the United States (Credit: Dr. David Lonard).
Given that primary tumors are composed of immune cells, vascular endothelial cells, fibroblasts, and cancer cells themselves, immunotherapies are an emerging approach for treating cancers. In breast cancer, immunotherapies have failed to show strong efficacy in spite of immune cell infiltration into breast tumors. Prostate cancers often do not respond well to immunotherapies. In contrast, renal cancers often do respond well to immunotherapies. A key part of improving immunotherapies is knowing what kind of immune cells are present in tumors. In an effort to determine how to improve immunotherapies, the relationship between SRCs and different kinds of immune cells was analyzed, using RNA-seq data from The Cancer Genome Atlas (TCGA). 29 marker genes for 17 different immune cell types were evaluated for their co-expression with SRC-1, SRC-2, and SRC-3 in breast, prostate, and renal cancer.
No immune cell type showed a strong correlation with SRC expression in breast invasive carcinoma.
A transitional B cell marker (CD93) showed strong correlation with all three SRCs analyzed in prostate cancer. The correlations are shown below.
| SRC Gene | NCOA1 | NCOA2 | NCOA3 |
| Correlation with CD93 in Prostate Cancer | 0.458 | 0.469 | 0.518 |
CD93 also showed strong correlation with SRC-1 and SRC-3 in renal clear cell carcinoma. The correlations are shown below.
| SRC Gene | NCOA1 | NCOA2 | NCOA3 |
| Correlation with CD93 in Renal Clear Cell Carcinoma | 0.522 | 0.221 | 0.594 |
CD93 is highly expressed in immune and endothelial cells. It is also expressed in platelets, monocytes, macrophages, microglia, neutrophils, activated macrophages, dendritic cells, and NK cells. To determine what type of cell CD93 is being expressed in, a second round of co-expression analysis was performed. This time the co-expression of CD93 with new cell type markers of cells that express CD93 was evaluated in the prostate and renal cancers. In total, 39 cell type markers were used. This additional analysis helped to eliminate non-immune cell false positives/false positive data.
In prostate cancer, CD93 strongly correlated with endothelial cells and activated macrophages.
| Cell Type | Cell Marker | Correlation with CD93 in Prostate Cancer |
| Endothelial Cells |
|
|
| Activated Macrophages |
|
|
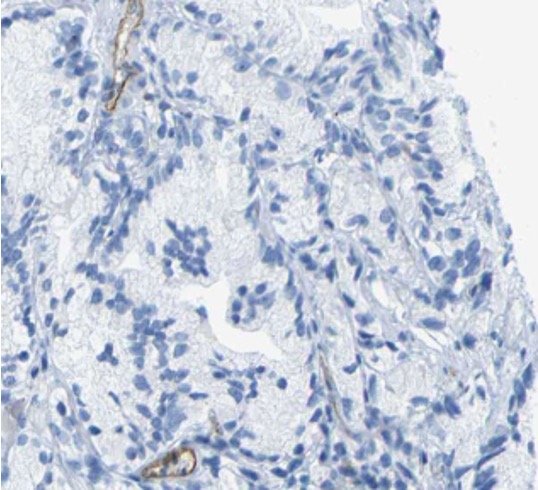
Immunohistochemistry images from the Human Protein Atlas were evaluated as well. The sample with CD93 being stained showed no expression of CD93 protein, which suggests a translational issue with CD93 in prostate cancer. The CD93 mRNA is present, but the protein is not. The image to the right shows a lack of CD93 protein expression.
In renal clear cell carcinomas, CD93 strongly correlated with platelets and activated macrophages.
| Cell Type | Cell Marker | Correlation with CD93 in Renal Clear Cell Carcinomas |
| Platelets |
|
|
| Activated Macrophages |
|
|
Immunohistochemistry images showed nothing of note. All proteins were expressed.
In conclusion, breast cancer showed no immune cell type mRNA co-expression correlation with any of the three SRC family members. In prostate cancer, CD93 mRNA co-expression strongly correlates with all three NCOA/SRC mRNA expression analyzed. CD93 expression in prostate cancer strongly correlated with endothelial cell and activated macrophage mRNA expression, but the CD93 protein was not expressed at high levels in immunohistochemistry images. This suggests a possible translational issue with CD93 in prostate cancer. In renal clear cell carcinoma, CD93 mRNA expression strongly correlates with SRC-1 and SRC-3 mRNA expression. CD93 mRNA expression strongly correlates with platelet and activated macrophage mRNA expression. There were no notable issues with protein expression in renal clear cell carcinoma.
I would like to thank Dr. David Lonard and Dr. Bert O'Malley for their help throughout the summer. I would also like to thank Baylor College of Medicine for the opportunity to participate in the SMART Program.