Contact Info
Location
Career Connection
Slocum 207
Delaware, Ohio 43015
Slocum 207
Delaware, Ohio 43015
P 740-368-3152
E careers@owu.edu
E careers@owu.edu


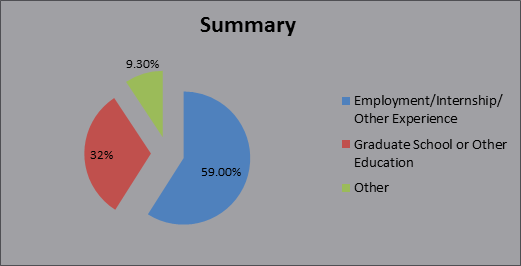
(It should be noted that some respondents are both employed and in graduate school.)
| Degree | Percentage |
|---|---|
| M.A. | 20.6% |
| Other* | 18.9% |
| M.S. | 17.2% |
| Ph.D. | 13.7% |
| J.D. | 6.9% |
| M.F.A. | 5.2% |
| M.D. | 5.2% |
| M.P.A. | 5.2% |
| M.B.A. | 3.4% |
| M.Div. | 3.4% |
* C.P.N.A., D.P.T., D.O., D.V.M., M.Ed., M.M., M.P.H., M.P.P., M.S.W., Bach. Culinary Arts, Accred.
| Area | Percentage |
|---|---|
| Social Sciences | 25.8% |
| Natural Sciences | 15.5% |
| Business | 10.3% |
| Medicine | 10.3% |
| Fine Arts | 8.6% |
| Health Services | 8.6% |
| Law | 6.9% |
| Humanities | 5.2% |
| Theology | 3.4% |
| Math / Phys. Sci. | 1.7% |
| Area | Percentage |
|---|---|
| Education | 18.9% |
| Business | 12.6% |
| Social Services | 10.5% |
| Health / Medicine | 9.4% |
| Finance | 8.4% |
| Environmental | 6.3% |
| Government | 6.3% |
| Communications | 5.2% |
| Technology | 5.2% |
| Sports | 4.2% |
| Arts | 3.1% |
| Energy | 3.1% |
| Museum / Library | 2.1% |
| Science | 2.1% |
| Other* | 2.1% |
* Architecture, Tourism
Instagram @owucareers